Skip to content

To conduct a two independent sample comparison of means test, you follow very similar steps as described in the one sample test with some modifications. For this problem, we want to compare the average weights of blue crabs in two river basins: (1) Tar-Pamlico and (2) Neuse River. Based on the health of the two rivers, we believe that the crabs in the Neuse will be larger, on average, and would like to test for this effect. We randomly sample 100 blue crabs in each basin. The mean weight of the Tar Pamlico crabs is 700 grams with a standard deviation of 300g (stp). The mean weight of the Neuse crabs is 800 grams with a standard deviation of 400 grams (sn). A side-by-side boxplot of the two samples is shown below.

1. Decide type of comparison of means test.
This problems illustrates a two independent sample test. We will use the Welch’s t-test which does NOT require the assumption of equal variance between populations.
2. Decide whether a one- or two-sided test.
This is a one-sided test in which we hypothesize that the crabs in the Neuse will weigh more than the crabs in the Tar Pamlico basin.
3. Examine the appropriateness of a comparison of means test (based on the assumptions)***.
See below.
4. Establish null and alternative hypotheses.
Ho: µneuse – µtarpamlico ≤ 0
Ha: µneuse – µtarpamlico > 0
Because we want to test if the Neuse crabs are larger than the crabs in the Tar Pamlico basin, we set the alternative hypothesis to state that the mean weight of crabs in the Neuse minus the mean weight of TP crabs is greater than zero. The null hypothesis should cover all other possible outcomes. Please note that the population parameters are used in the hypotheses and NOT the sample statistics.
5. Decided whether a z-statistic or t-statistic is appropriate.
We do not know the true standard deviations of the weights of the crabs in the two basins. Therefore it is most appropriate to use a t-test in this example. If the sample size is large enough, the t-distribution will approximate the normal distribution.
6. Calculate sample mean(s).
The sample means are given in this problem. The mean weight of Tar Pamlico crabs is 700 grams, while the mean weight of the Neuse crabs is 800 grams.
7. Calculate standard deviation of sample IF using a t-test.
The standard deviations are given in the problem (400 g (Neuse) and 300 g (Tar Pam)).
8. Calculate the Welch’s t-statistic
As you may recall from the one sample module, the general form of a test statistic is:
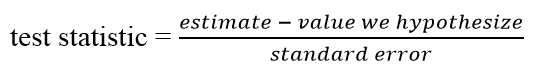
In the case of two independent samples, our estimate is the difference between the two sample means. The hypothesized value is the difference we hypothesize between the two true population means—this is often zero (to test whether there IS a difference or not between the means of the two populations).
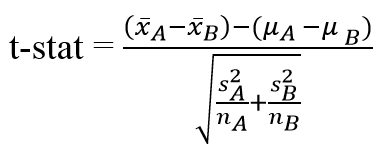
In a Welch’s two independent sample t-test, we estimate our standard error using the sample standard deviations.

Statistical packages estimate the degrees of freedom for the Welch’s t-test, or more simplistically (and less accurately) we can estimate the degrees of freedom by subtracting one from the smaller of the two sample sizes (in this case 99). So in this problem, the t-statistic equals (800 – 700)/50 = 100/50 = 2, with an estimated degrees of freedom of 99.
9. Determine p-value from the test statistic using the appropriate z or t distribution.
A t-stat of 2, with 99 degrees of freedom, corresponds with a small p-value–less than 0.025 (p(t>2)<0.025). We can reject the null hypothesis at an alpha of 0.05.
10. Interpret the p-value in terms of the hypotheses established prior to the test.
These results suggest that the mean weight of blue crabs in the Neuse are greater than the mean weight of blue crabs in the Tar Pamlico.
**Assumptions of a Two Independent Sample Comparison of Means Test with Unequal Variance (Welch’s t-test)
In a two independent sample comparison of mean test (with unequal variance), we assume the following:
1. Populations of concern are normally distributed.
2. Observations are independent within and between samples.
Based on our sample data, as illustrated in the boxplot above, we will assume that the two populations are normally distributed. Because we conducted a simple random sample of crabs, we will assume that the observations are independent within and between samples. We should test for spatial autocorrelation in our data, as crab weight might be spatially related, and therefore invalidating our results.
This website was developed by Elizabeth A. Albright, PhD of the Nicholas School of the Environment, Duke University.
Follow Elizabeth A.Albright, PhD on Twitter @enviro_prof. If you found these pages useful, please link or share via Facebook or Twitter. Thanks!