Below are some of our preliminary results from the PFAS Exposure Study. We thank all of the participants and community members who provided samples and feedback for our study. These results describe the levels of PFAS that we measured in blood samples provided by Pittsboro, NC residents. We have also compared our results to other studies that measured PFAS blood levels in the general US population and in Wilmington, NC. There is still more research to be done to understand how PFAS blood levels may impact health. We expect to add more results on this webpage from other studies as data become available.
River Study

Water Sample Sites along the Haw River
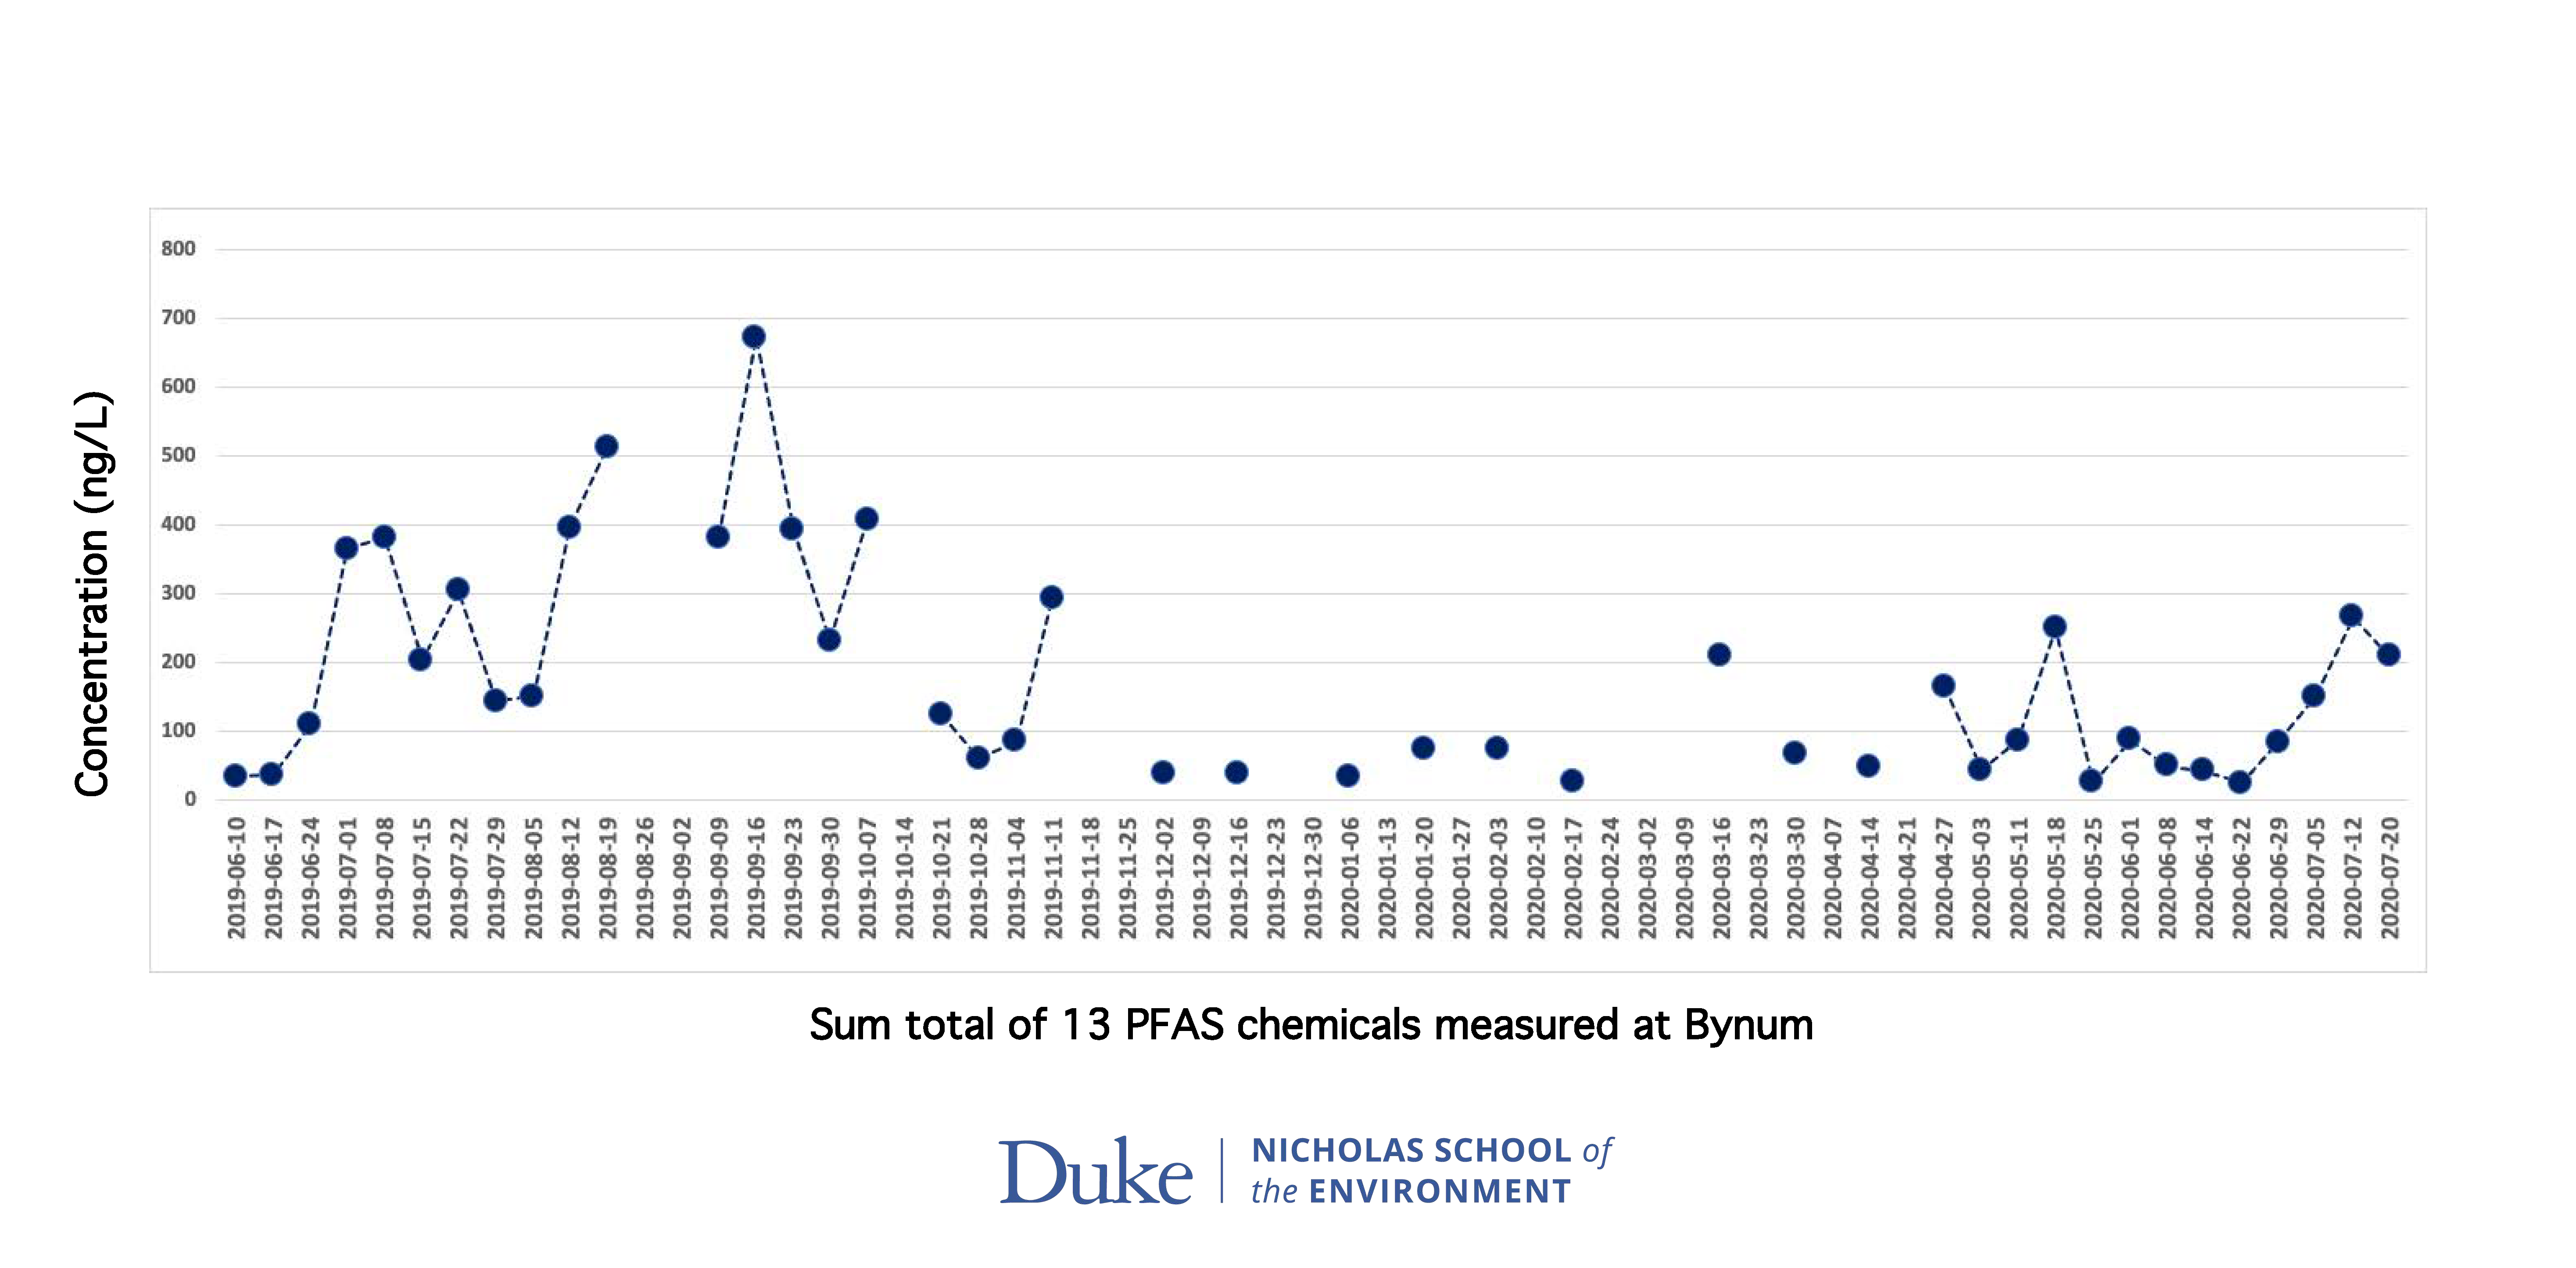
Our research team has been sampling the sites marked with stars on this map weekly since June of 2019. After collecting the water samples each week, they are analyzed for PFAS and recorded in order to study how PFAS levels change over time. The graph below shows our measurements of PFAS over time, collected at the Bynum bridge sampling site, indicated on this map with the yellow star.
PFAS Levels Measured in the Haw River Over Time

This graph displays the total concentration of 13 PFAS measured in Haw River surface water samples collected at Bynum near the intake for the drinking water treatment plant. Note that concentrations change substantially over time. We are hoping to determine how much of this change is due to rainfall, evaporation, runoff, and point sources upstream.
*Missing points indicate that samples were not collected in that particular week.
Exposure Study
PFAS Analytes Measured in Blood Serum

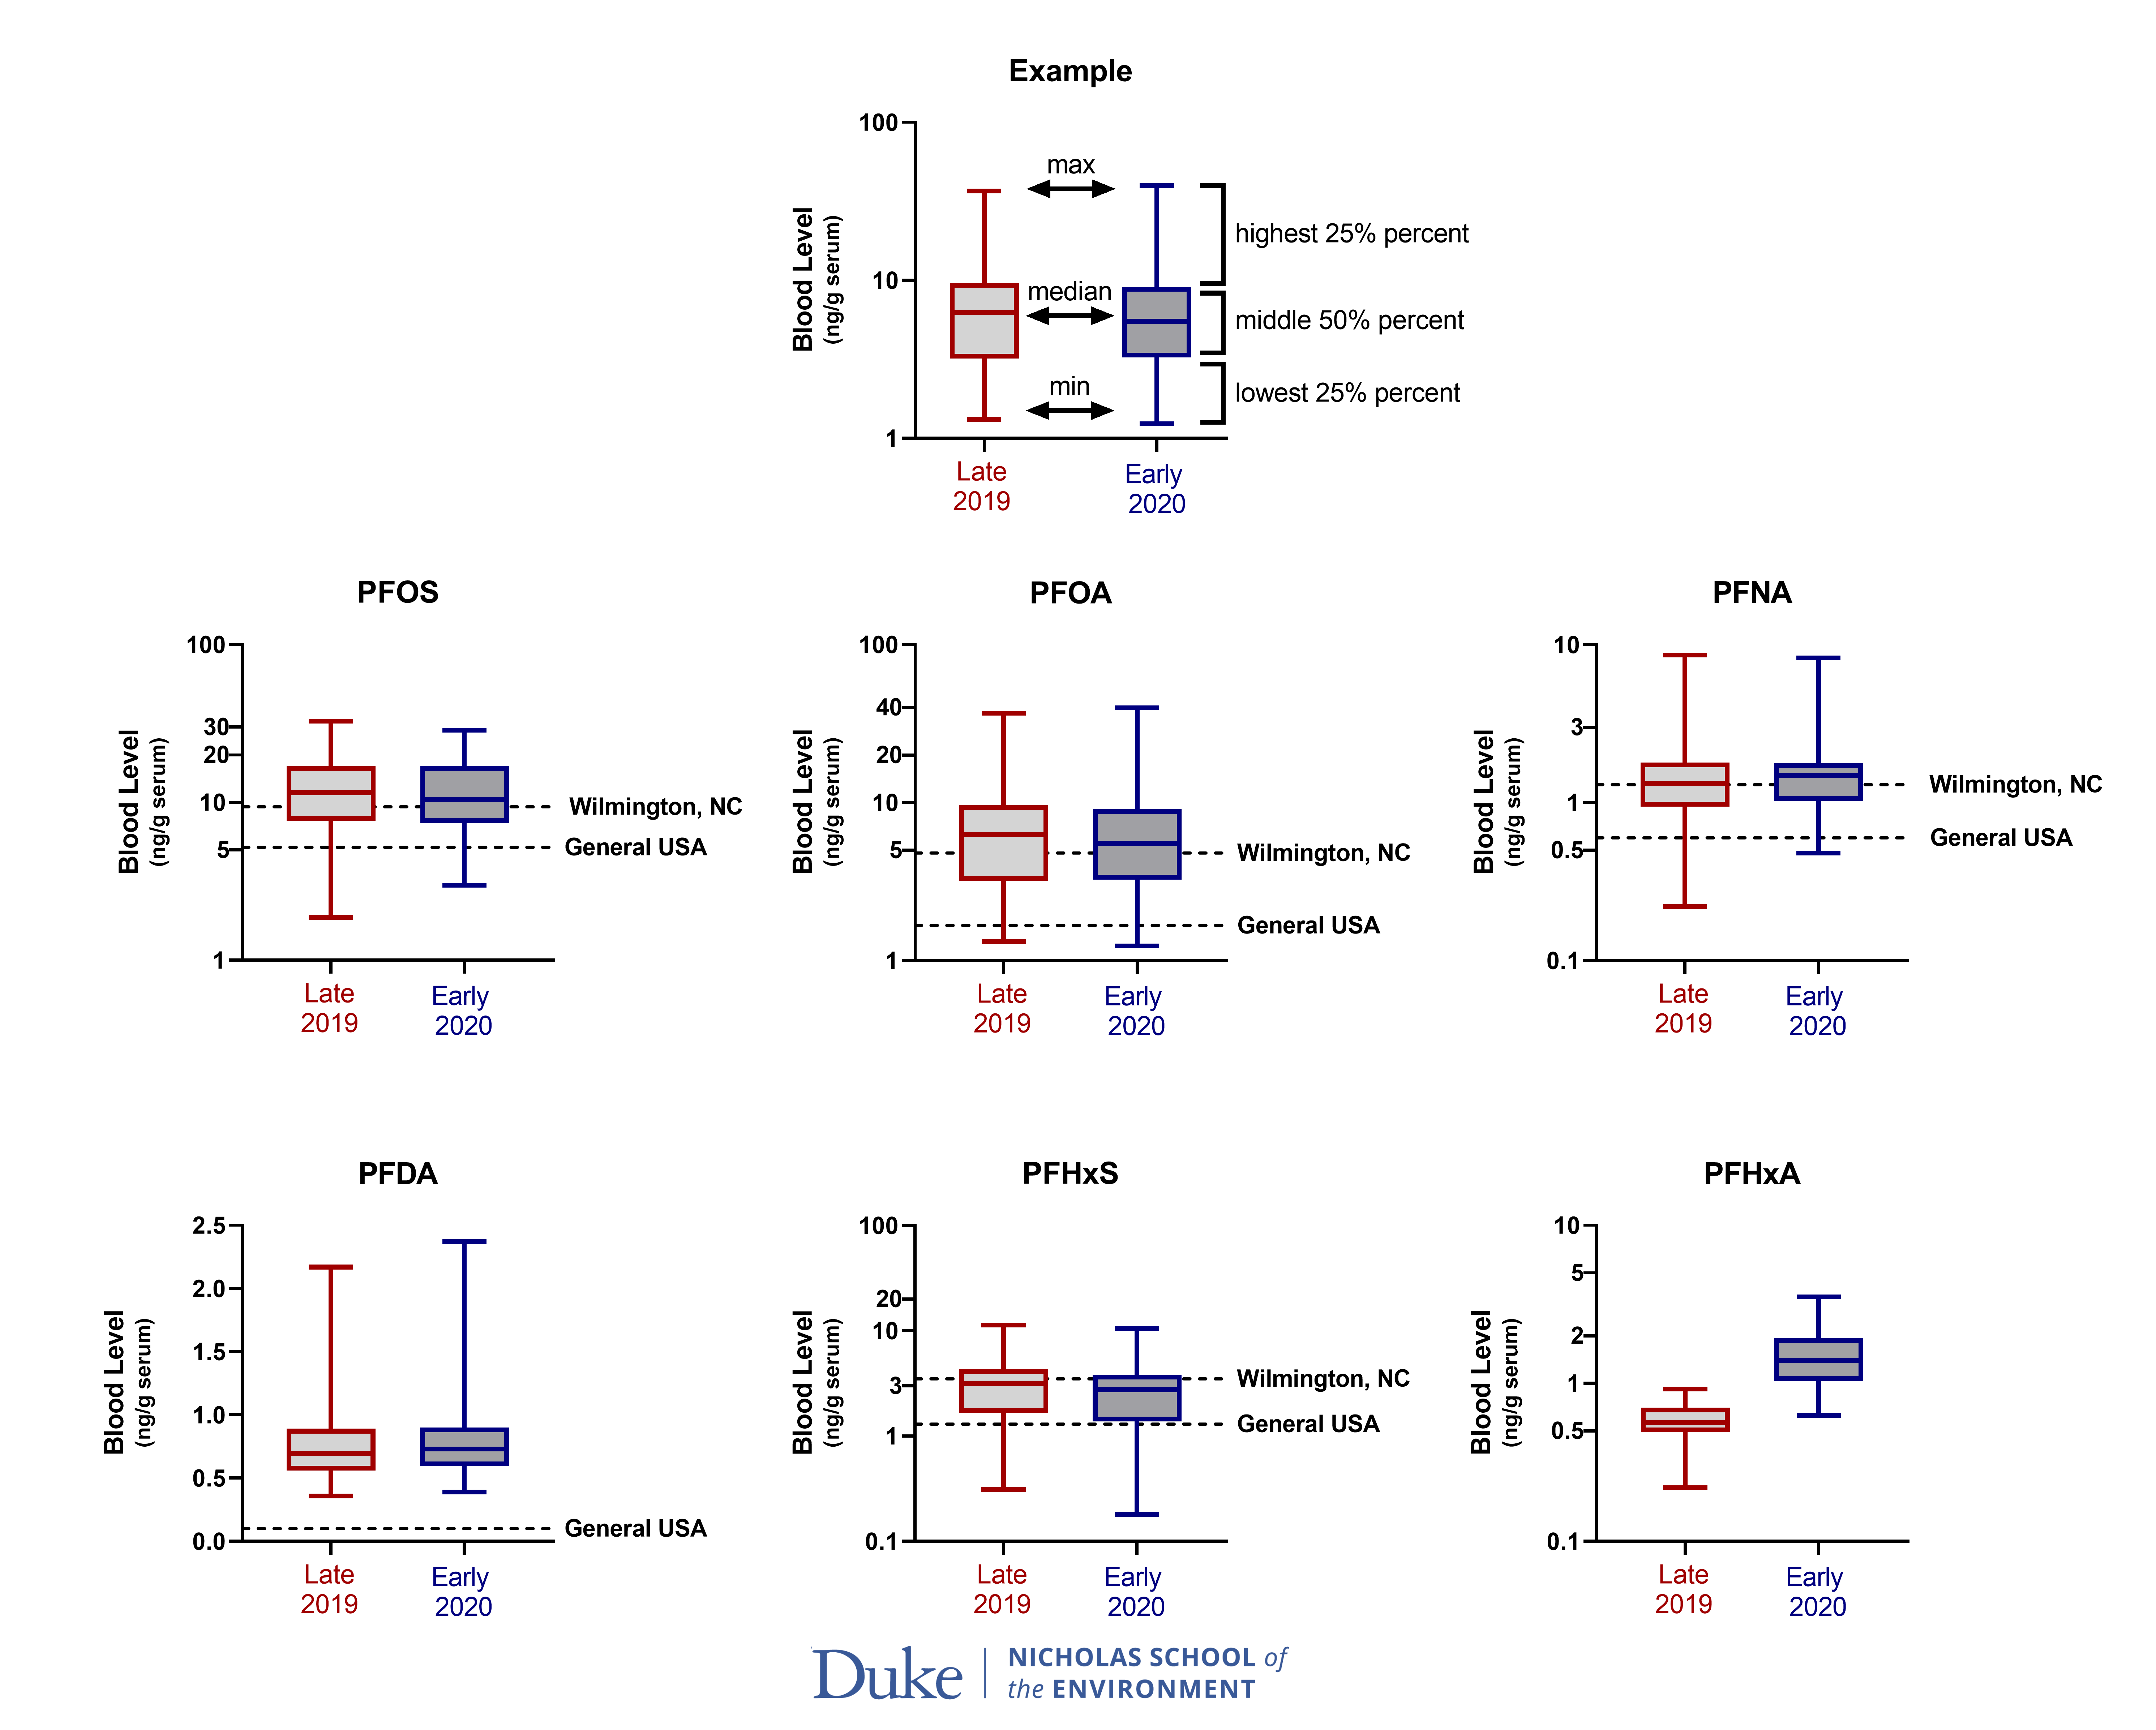
This figure shows boxplots for 6 PFAS analytes measured in blood from the PFAS Exposure Study. Blood was collected from 49 participants in total, and both of our collection timepoints are shown. Solid lines on the boxplot depict minimum, median, maximum, and 25th and 75th percentile levels. Dashed lines represent the median blood levels reported from two other adult populations: Wilmington, NC (Kotlarz et al., 2020) and General US population (NHANES 2015-2016)
PFAS Levels Measured in Drinking Water

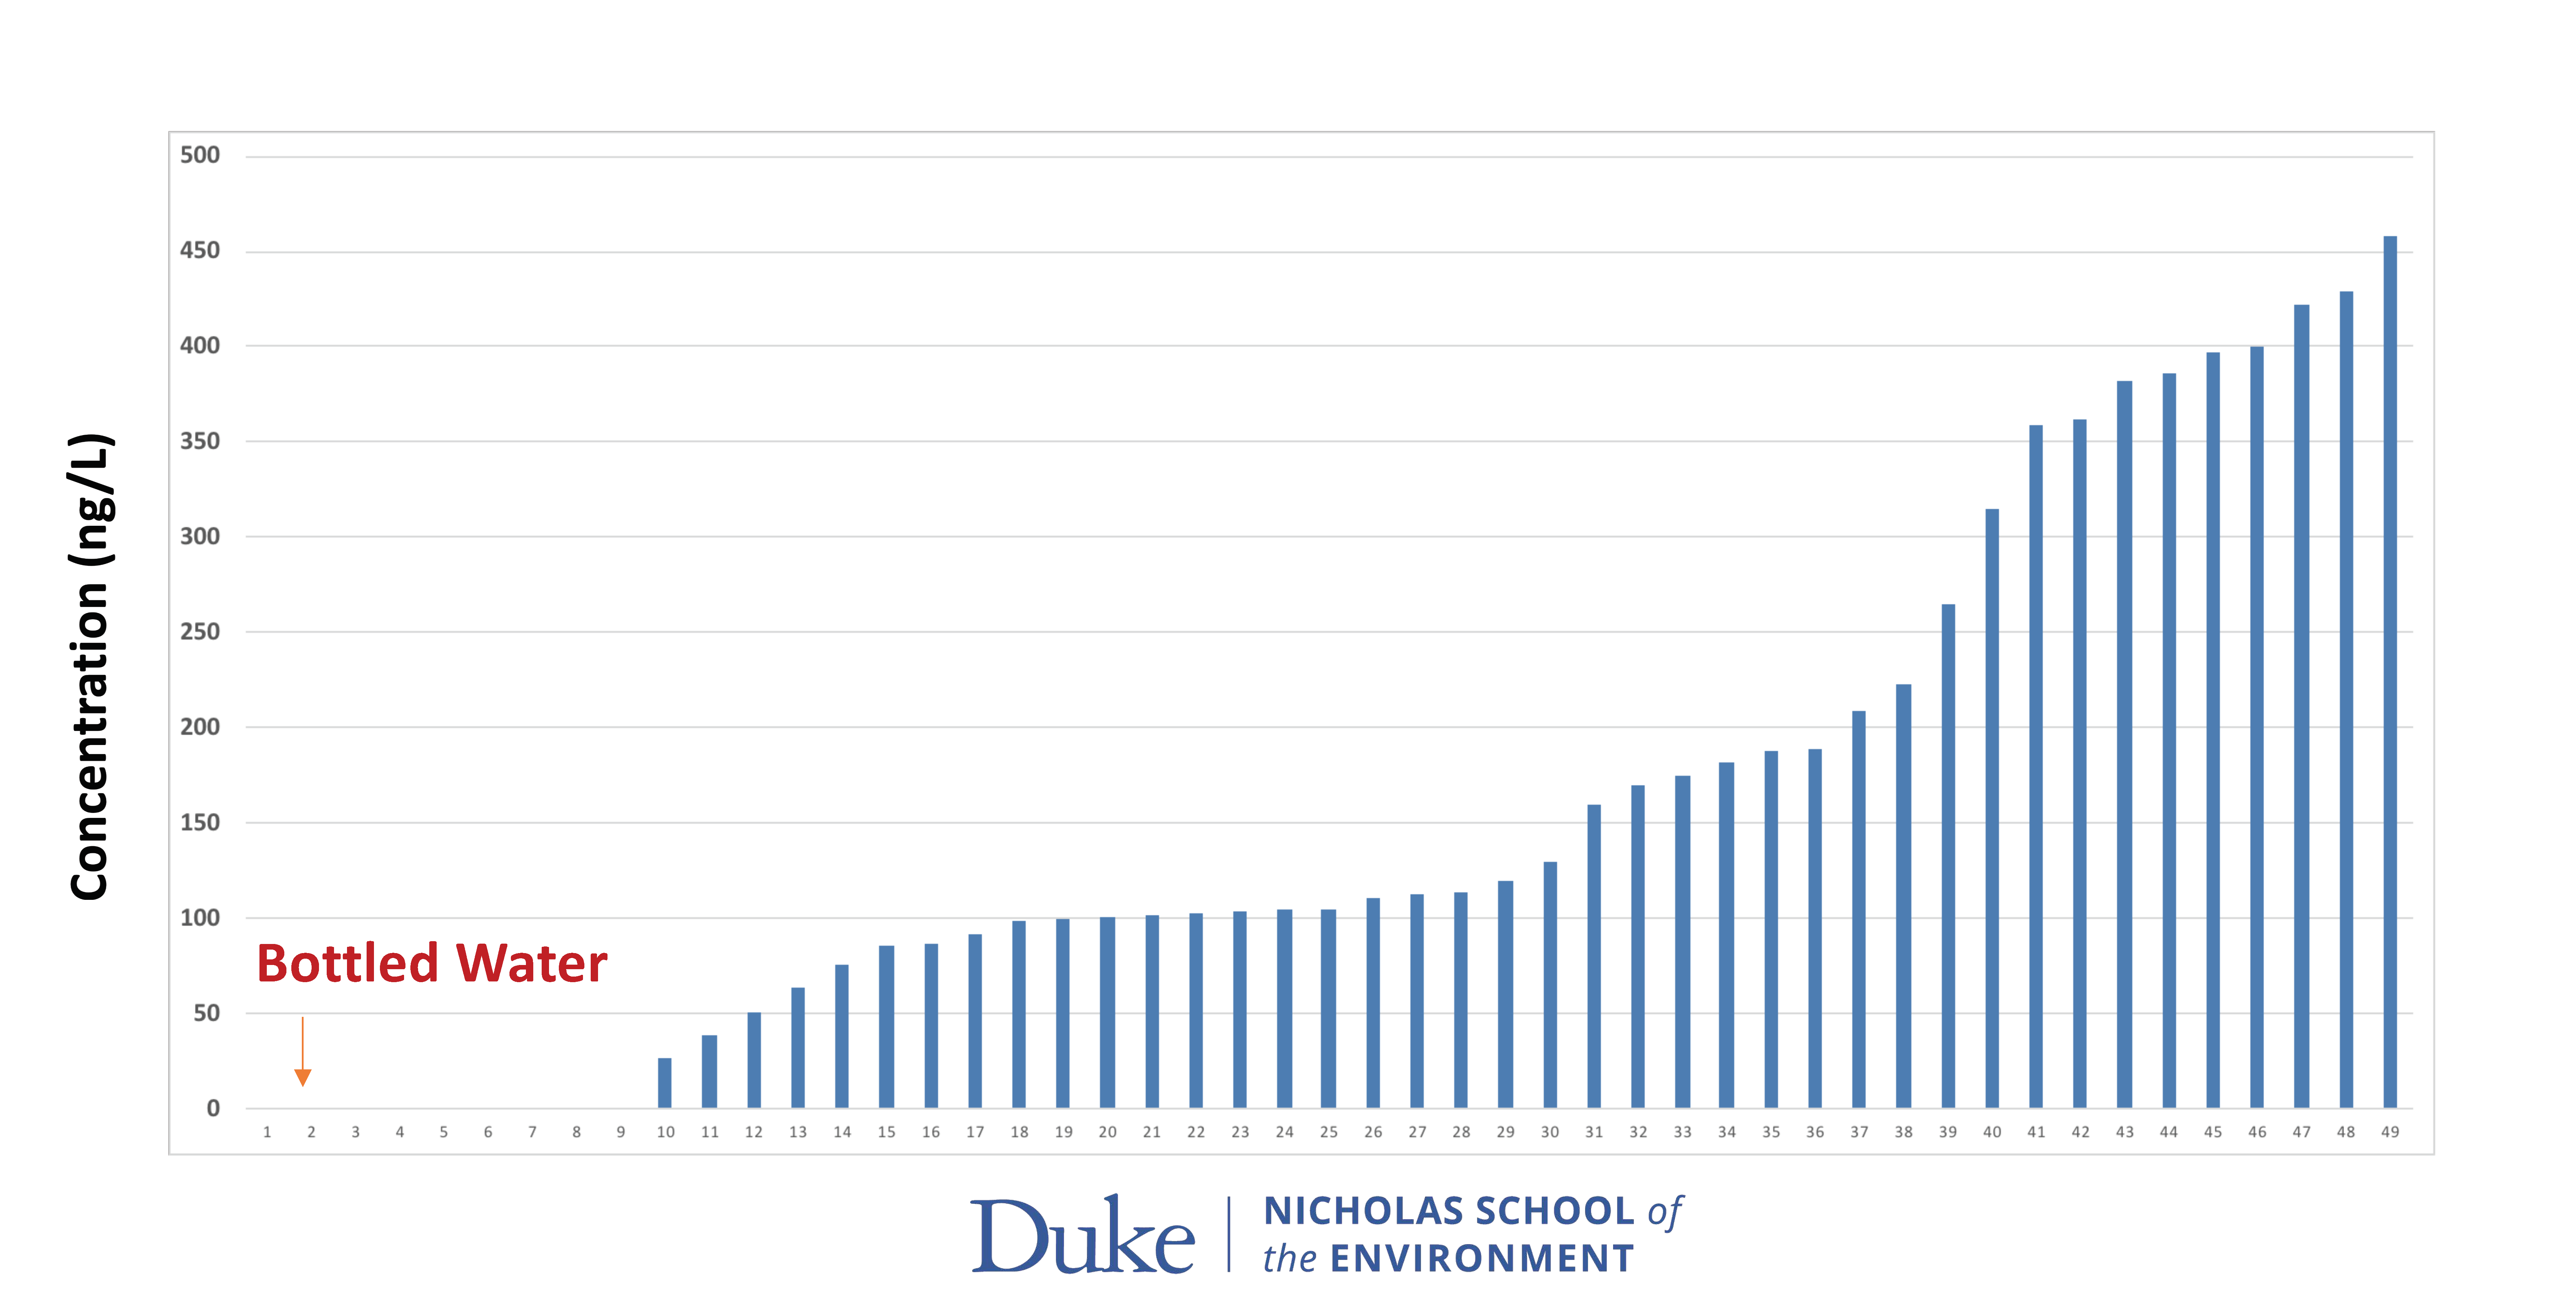
This figure represents the total amount of PFAS measured in the 49 drinking water samples collected from each study participants' home. Values ranged from not detectable to 452 ng/L. Note that these values are higher than the EPA health advisory limit of 70 n/L. The type of water filter used in each home likely impacted the observed variability.
List of PFAS Analytes in Blood and Water
Compound Name |
Abbreviation |
CAS Number |
|
Perfluorobutanoic acid
|
PFBA
|
375-22-4
|
|
Perfluoropentanoic acid*
|
PFPeA
|
2706-90-3
|
|
Perfluorohexanoic acid
|
PFHxA
|
307-24-4
|
|
Perfluoroheptanoic acid
|
PFHpA
|
375-85-9
|
|
Perfluorooctanoic acid
|
PFOA
|
335-67-1
|
|
Perfluorononanoic acid
|
PFNA
|
375-95-1
|
|
Perfluorodecanoic acid
|
PFDA
|
335-76-2
|
|
Perfluorobutane sulfonic acid
|
PFBS
|
375-73-5
|
|
Perfluorohexane sulfonic acid
|
PFHxS
|
355-46-4
|
|
Perfluorooctane sulfonic acid
|
PFOS
|
1763-23-1
|
|
Hexafluoropropylene oxide dimer acid
|
GenX (HFPO-DA)
|
62037-80-3
|
|
4:2 fluorotelomer sulfonic acid
|
4:2 FTS
|
27619-93-8
|
|
6:2 fluorotelomer sulfonic acid
|
6:2 FTS
|
27619-94-9
|
Please use this chart to reference each PFAS chemical that we measured in tap water and participants' serum. Each analyte has its own Chemical Abstracts Service (CAS) number, which is a unique identifier that can be used to search more detailed information about the analyte. CAS numbers, paired with the chemical acronym, are searchable in any search engine if further information about each chemical is of interest
Health Study
Epidemiological studies have shown that PFAS are associated with adverse health effects, including thyroid disease, cancer, and reproductive outcomes. Here, we examined associations between exposure to PFAS (using watershed as a proxy for PFAS exposure) and birth outcomes, focusing on birth weight and gestational age at birth. We used birth certificate data for infants born near the Cape Fear and Haw Rivers. We found some variation in birth weight in the communities evaluated. The largest difference in birth weight was observed in the Headwaters of the Cape Fear River, where male infants were born lighter on average, and were born earlier, compared to infants born to women drinking water from Falls Lake. Similar patterns were observed in populations drawing water from Lake Mackintosh, Jordan Lake, and Wilmington, whereas no statistically significant differences in birth outcomes were observed in the population drawing water from the Haw River. These results suggest there are spatial differences in adverse birth outcomes across NC, which may be due to exposure to contaminants in water such as PFAS; however, future studies are needed to specially examine PFAS exposures at the individual level.
This research was part of a master’s project lead by Connie Xiong, a 2020 graduate of the Nicholas School of the Environment at Duke University. Her full project can be found at https://dukespace.lib.duke.edu/dspace/handle/10161/20510.
Animal Study
Preliminary study results are pending.
Policy Study
Preliminary results are pending.
