The New Odyssey
Protocol for using iTag
This week, I finished tagging the images taken by the eBee using iTag. The next step was to write a protocol for taking the photographs and turning them into data so others can do it as well. It is pretty exciting to be doing this because I was the first person to use the iTag program with photographs taken by the eBee. Once I have finished it, the protocol will be sent to other researchers to be used when analyzing similar data. Also now that I have finished tagging the photos, others will do the same and then we determine the actually count of grey seals on both Hay and Saddle Island.
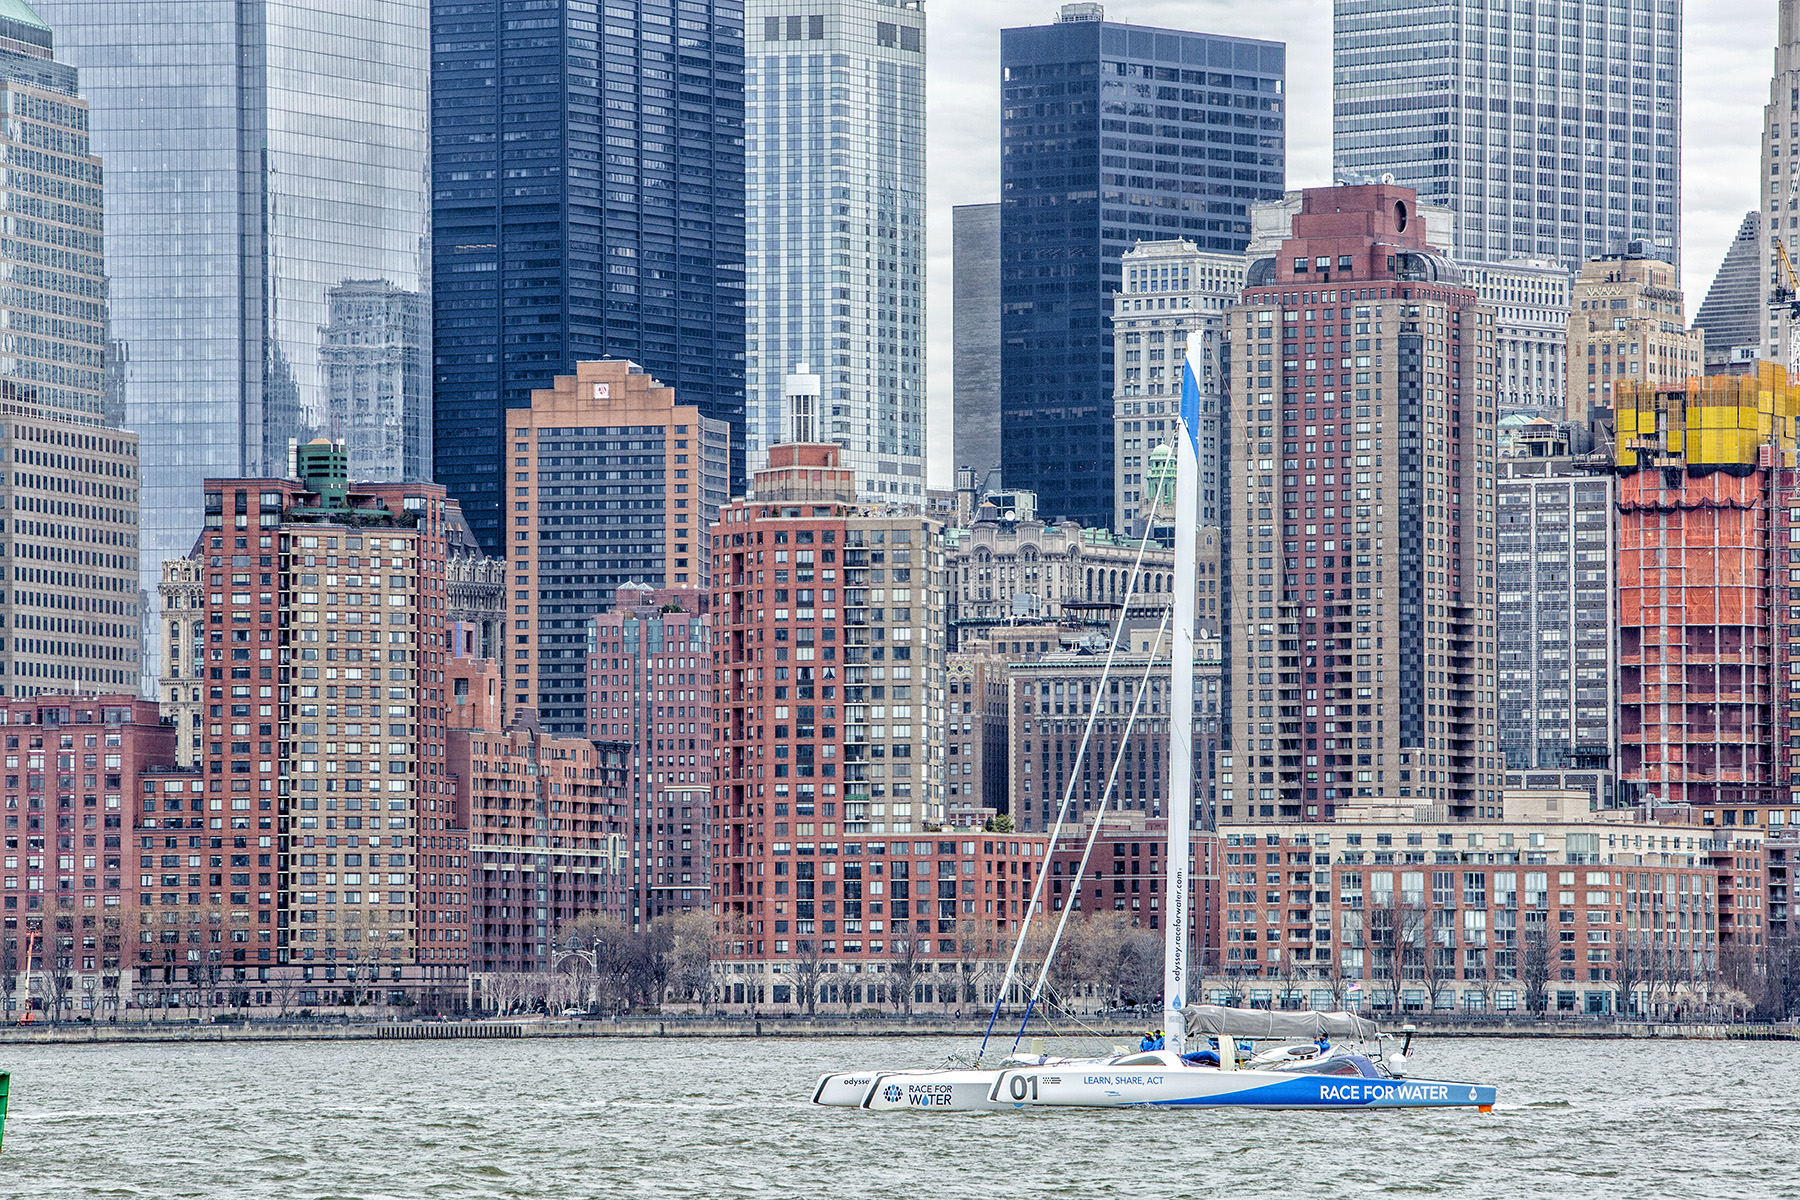
The “Race for Water Odyssey”
Also, while I am here this summer I have the opportunity to help out on other research projects. The Race for Water Foundation has initiated a sailing expedition to assess the plastic pollution in the ocean. They will be sailing to and visiting island beaches that are located in the 5 trash vortexes in our oceans. While visiting islands that encompass a total of 13 countries, the ocean explorers will be utilizing the Sensefly eBee to assess the macro-plastic that is present on the shoes. Duke University and Oregon State University are cooperating to test the eBee’s ability to detect the macro-plastic and assess the eBee’s capabilities in this area.
So far the explorers have collected data from Grape Bay in the Bermuda, Porto Pim, Conceição, and Praia do Almoxarife, The Azores, and most recently Anakena, Ovalie and Tongariki on Easter Island. Once they have collected the data, it is sent to us at the Duke University Marine Lab, so the data can be uploaded and analyzed. I am lucky to be able to help out in this analysis to learn a new set of skills that can revolutionize how marine debris is assessed.
I am also able to assist on the processing of the imagery captured by the eBee. The flight paths and photographs taken are uploaded in the Postflight Terra 3D developed by Sensefly to create geo-referenced 2D orthomosaics, 3D point clouds, triangle models and Digital Elevation Models (DEMs). A geo-referenced 2D orthomosaic is essentially a near real-time land-cover map that could be used to show what the land currently looks like and what is present, for example marine debris. 3D point clouds are a set of data points in the same coordinate system and are defined by X, Y, and Z. This helps to show the external surface of the surveyed area. The Postflight Terra 3D software also creates a reflectance map of the surveyed area. This process is an effective image-based lighting technique for approximating the appearance of a reflective surface. It measures different bands of color reflected such as red, green and blue bands and displays them over the surveyed area.
I am working with the Postflight Terra 3D software to generate the red, green, blue and grayscale Index maps. These maps will be helpful in identifying macro-plastics along the shorelines surveyed by the ocean explorers with the Race For Water Odyssey, by understanding the spectral reflectance of different kinds of plastics. Its exciting to get to work on other cutting edge research projects while I am here and gaining new skill sets that can benefit me in the future.