Tag: environmental regulation

Integration of the Shrimp Market and Why Environmentalists Should Care

Frank Asche, Atle Oglend, Marty Smith and I have a new paper that looks at the determinants of prices in different shrimp markets–prices for big and small shrimp; prices for brown, white and pink shrimp; and prices for wild-caught shrimp and farmed shrimp.   In particular, we look to see whether prices for different categories of shrimp (different sizes, species, and methods of production) move in tandem.  Consumer decisions in markets are a function of relative prices of goods.   Thus, if the prices of large and small shrimp move in tandem, then the relative prices of the two sizes of shrimp do not change and consumers choices in the shrimp market should remain unaffected.  If this is true across all types of shrimp we say the market is integrated.

There are two important facts to know about the shrimp market.  First, we consume a lot of shrimp.  Shrimp is the leading seafood product by value.  In 2006, shrimp accounted for 17% of all global seafood trade (FAO 2009).  It is also the leading seafood product by weight.  Americans consume 4.2 pounds of shrimp per capita annually.  The next largest seafood product is canned tuna of which we consume only 3.3. pounds per capita (NRC 2007).  Second, the method by which shrimp is “produced” has changed dramatically over the last decade.  As you can see in Figure 1, farmed (or aquaculture) shrimp has skyrocketed in the last decade and now accounts for more than 50% of global shrimp production.

Figure 1: Shrimp Production Over Time

But why focus on prices and market integration?  There are at least four reasons why the nature of the shrimp market matters.  First, the increased competition from farmed shrimp has lead to trade disputes.  The U.S. enacted trade restrictions on shrimp from a group of countries (all in Asia or Latin America) after domestic shrimp fisherman filed anti-dumping complaints (Keithly and Poudel, 2008).  Second, diseases have been an issue for farmed shrimp, particularly white spot disease (Anderson, 2003)  Third, there are significant environmental shocks that affect the supply of domestic wild-caught shrimp.  For U.S. shrimp fishermen the  “dead zone” that occurs seasonally in the Gulf of Mexico potentially influences aggregation, production, and the size distribution of shrimp (Craig 2011; Huang, Smith, and Craig, 2010; Huang et al. 2011). Hurricanes Katrina and Rita caused significant shrimp supply disruptions through destruction of shrimp vessels and processing facilities (Buck 2005), while rising fuel prices are particularly costly for wild-caught shrimp because trawling is fuel-intensive (Ran, Keithly, Kazmierczak 2011), Moreover, costs of complying with the U.S. requirement for shrimp trawlers to use Turtle Excluder Devices decreased domestic supply (Mukherjee and Segerson 2011).

The degree of market integration affects how these environmental and economic stressors affect prices.  The impact of all of these stressors (trade, production costs, disease, and environmental) will have a strong impact on the price determination process if the markets are not integrated, while the impact will be weaker in a larger and more integrated shrimp market.

We use monthly price series data from June 1990 through December 2008 to investigate market integration.  The details of the statistical analysis are available in the paper, but Figure 2 captures the idea graphically.  In Figure 2, we plot the price trends for different sizes of brown shrimp caught in the U.S.  The graph shows remarkable co-movement in prices of different sizes.  Our statistically analysis bears out this observation.  Prices of different sizes of brown, pink, and white shrimp move in tandem.  Prices of U.S. wild-caught shrimp and imported farm shrimp move in tandem.  The shrimp market is remarkably well integrated.

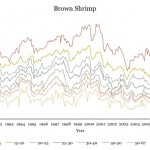
Figure 2: Brown Shrimp Prices By Size Class

Why should environmentalist care?  Market integration has significant implications for how domestic wild-shrimp fisherman can respond to certain environmental supply shocks. In North Carolina (a much smaller market than Gulf of Mexico), there is evidence that hypoxia has decreased shrimp production in the range of 13% but has not increased prices (Huang, Smith, and Craig 2010; Huang et al. 2011). In the much larger Gulf of Mexico,  there is emerging evidence that hypoxia decreases the supply of large shrimp and increases the supply of smaller shrimp likely as a result of aggregation on the edge of hypoxic areas (Bennear, Kociolek, and Smith 2011; Craig 2011).  Market integration suggests that the decreased supply of large shrimp cannot be offset by an increase in price.  Rather, imports of larger farmed shrimp will increase to satisfy demand.  Similarly, domestic supply shocks from hurricanes, oil spill, or fuel price spikes cannot be offset by price increases. In particular, market integration suggests that the economic losses from a significant decrease in 2010 domestic shrimp production – assuming this decrease was caused by the Deepwater Horizon oil spill – was not likely offset by a price increase.  Market integration thus has important implications for the long-run economic viability of the U.S. shrimp fishery.  The losses from supply shocks are more consequential for producers, and the various shocks are additive as economic challenges to the fishery. But U.S. shrimp consumers are essentially unharmed.

——-

Anderson, J.L. 2003. The International Seafood Trade. Cambridge: Woodhead Publishing.

Bennear, L.S., E. Kociolek, and M.D. Smith. 2011. Estimating the effect of hypoxia on the Gulf Coast shrimp fishery. Selected Paper, AERE Summer Conference. Seattle, WA, June 2011.

Buck, E.H. 2005. Hurricanes Katrina and Rita: Fishing and Aquaculture Industries – Damage and Recovery. CRS Report for Congress, RS22241, Washington DC: Congressional Research Service.

Craig, J.K. 2011. Aggregation on the edge: Effects of hypoxia avoidance on the spatial distribution of brown shrimp and demersal fishes in the northern Gulf of Mexico. Marine Ecology Progress Series (in press).

FAO. 2009. The State of the World Fisheries and Aquaculture 2008. Rome: Food and Agricultural Organization of the United Nations.

Huang, L., L.A.B. Nichols, J.K. Craig, and M.D. Smith. 2011. Measuring Welfare Losses from Hypoxia: The Case of North Carolina Brown Shrimp. In Review.

Huang, L., M.D. Smith, and J.K. Craig. 2010. Quantifying the Economic Effects of Hypoxia on a Fishery for Brown Shrimp Farfantepenaeus aztecus. Marine and Coastal Fisheries: Dynamics, Management, and Ecosystem Science. 2:232-248.

Keithly, W. R. Jr., and P. Poudel. 2008. The Southeast U.S. Shrimp Industry: Issues Related to Trade and Antidumping Duties. Marine Resource Economics 23:459-83.

Mukherjee, Z. and K. Segerson. 2011. Turtle Excluder Device Regulation and Shrimp Harvest: The Role of Behavioral and Market Responses. Marine Resource Economics 26: 173-189.

Ran, T., W.R. Keithly, and R.F. Kazmierczak. 2011. Location Choice Behavior of Gulf of Mexico Shrimpers under Dynamic Economic Conditions. Journal of Agricultural and Applied Economics, 43:29–4

Jobs Versus Children’s Health—A false choice

In January 2009 I was awoken by the sound of my eldest child wheezing and gasping for air.  We called 911 and emergency personnel arrived to give her some oxygen.  After a short time they determined it was a severe croup episode and not, as I feared, a first asthma attack.  But that is a night I will never forget.  The fear you feel as a parent when your child cannot breathe is intense.  Millions of parents live with that background fear on a daily basis because their children suffer from chronic asthma. The Centers for Disease Control estimate that 7.0 million children (9.4%) have asthma as do 17.5 million (7.7%) adults.[i] Asthma results in 17.0 million health visits per year, 450,000 inpatient hospital stays with an average length of 3 days, and 3,447 deaths.[ii]

What does all this have to do with Environmental Economics?

President Obama recently asked EPA Administrator Lisa Jackson to withdraw a proposed refinement of the National Ambient Air Quality Standards (NAAQS) for ground level ozone that would have lowered allowable ozone levels from 0.84 parts per billion (ppb) to a range of 0.60 to 0.70 ppb.  Ground level ozone (not to be confused with stratospheric ozone which has the big hole) is also known as smog, and is a key contributor to asthma and other illnesses and deaths.

To be fair, the ozone NAAQS will be revisited in 2013, so Obama’s decision really only put off the debate for two years.  But why delay two years when the rule was ready to go forward now?  Must be economics.  Or is it?

In announcing his decision, President Obama said “I have continued to underscore the importance of reducing regulatory burdens and regulatory uncertainty, particularly as our economy continues to recover.”[iii] The announcement was made shortly after a bad jobs report was issued which further enhances the appearance that the postponed regulation was a “job killer.”  But the jobs versus environment rhetoric is just that—rhetoric.  It has no basis in economic analysis because economic analysis is not based on counting up jobs!

A good economic analysis compares the costs of complying with the regulation to the benefits resulting from the regulation.  The benefits in this case are the health benefits associated with reduced incidence of asthma and other health impacts.  Compliance costs include costs of purchasing new pollution control equipment, changing fuel sources, changing operational practices, and so forth.  The jobs analysis is really a non-starter.  Could we lose some jobs if we require more regulatory expenditures—certainly.  Could we gain jobs in industries that are selling and developing pollution control equipment–certainly.  Are these exactly a wash—probably not.  But we will also reduce hospitalizations, school days missed, and even deaths from asthma and other illness.  The key is that economic analysis is not “jobs analysis.” We do our best to measure the benefits and the costs of compliance in dollars.  Then we can compare dollars spent to dollars gained and not compare jobs to asthma cases.

So what did the economic analysis of the proposed ozone rule say about the costs and benefits of tightening the standard?  Not a lot that is useful, unfortunately.  This is not because the economic analysis is badly done (although I might quibble a bit on a few points), but rather because there is significant uncertainty over both costs and benefits of the proposed rule.  There are at least three major sources of uncertainty in the economic analysis.

  1. Modeling uncertainty:  Ozone isn’t a pollutant that gets directly emitted from smokestacks or tailpipes.  Ozone is the result of combining two other pollutants, NOx and VOCs, with sunlight.  As a result, you have to model the ozone-generating process and estimate how many counties might not be in compliance when the rule becomes binding in 2020.
  2. Cost uncertainty:  Once you estimate which counties would exceed the standard you need to come up with estimates of compliance.  But for some counties it was estimated that compliance was not possible with known technologies.  Compliance in 2020 relies on technologies that we don’t know about in 2011 and cannot accurately price.  It also relies on estimates of how costs of current technologies may change over the next 9 years.
  3. Benefits uncertainty:  The benefits estimates rely on models of the relationship between ozone levels and deaths and illnesses.  There are several different models available in the peer-reviewed literature including three meta-analyses, yet these models still give answers that vary significantly.

These uncertainties mean that for each of the standards considered there is a large spread in estimated costs and estimated benefits such that the range of possible net benefits (benefits minus costs) always straddles zero.  The figure below captures the highest and lowest benefit and cost estimates for each standard.  You can see that the uncertainty in benefits is greater than the uncertainty in costs at all levels and that the uncertainty in both benefits and costs increases as the standard becomes more stringent.

click image to enlarge

Figure Source: United States Environmental Protection Agency.  Summary of the updated Regulatory Impact Analysis (RIA) for the Reconsideration of the 2008 Ozone National Ambient Air Quality Standard (NAAQS).  January 1, 2010. Available at:  http://www.epa.gov/ttnecas1/regdata/RIAs/s1-supplemental_analysis_full.pdf.  Last accessed, September 7, 2011.

With this much uncertainty in both costs and benefits, reasonable people could certainly disagree about the best course of action. I personally was very disappointed in President Obama’s decision.  I would strongly support an increase in stringency for the ozone standard based on the economic analysis presented in the Regulatory Impact Analysis.

How could I feel so strongly given all the uncertainties?  The reason is that historically we have systematically underestimated benefits from air pollution regulations and overestimated costs.  The retrospective benefit-cost analysis of the Clean Air Act from 1970-1990 estimated total benefits attributable to air regulations between 5.6 and 49.4 trillion dollars with a central tendency of 22.2 trillion.  The total costs were roughly 0.5 trillion.  That means that we are better off by around 21.7 trillion dollars because of these regulations.[iv]

Furthermore, most of the “unexpected” gains in benefits came from regulations of particulate matter.  The proposed ozone rule lowers emissions of NOx which also results in lower emissions of small particles (PM2.5) which are very harmful for health.  So if I had to bet on where we were likely to end up on the “distribution” of net benefits I would place my bet on higher end of the range.  And that means I’m betting that we are better off as an economy with more stringent ozone regulations.  I wish President Obama hadn’t caved to political pressures and supported his EPA Administrator in making that same bet.


[i] Centers for Disease Control and Prevention.  Fast Stats:  Asthma. Available at:  http://www.cdc.gov/nchs/fastats/asthma.htm.  Last Accessed:  September 8, 2011.

[ii] ibid

[iii] White House.  Office of the Press Secretary.  Statement by the President on the Ozone National Ambient Air Quality Standards. September 2, 2011.  Available at:  http://www.whitehouse.gov/the-press-office/2011/09/02/statement-president-ozone-national-ambient-air-quality-standards.  Last Accessed:  September 9, 2011.

[iv] United States Environmental Protection Agency. The Benefits and Costs of the Clean Air Act, 1970 to 1990.  Executive Summary. pp: ES-8.  Available at:  http://www.epa.gov/oar/sect812/1970-1990/812exec2.pdf.  Last Accessed: September 8, 2011.

Making the Planet Notice

My colleague and friend, Dr. Gernot Wagner, has a new book coming out, But Will the Planet Notice?:  How Smart Economics Can Save the World (available in hardback and kindle editions on October 5th).  The premise is that individual actions, like changing incandescent light bulbs to compact fluorescent, using groovy (yes, I said groovy) reusable grocery bags instead of plastic, and buying local food may make us feel better about our environmental impact, but actually do very little to reduce global climate change, resource use, or improve overall environmental quality.  To make the “planet notice” we need systematic and collective changes in behavior.

In this class you will learn that, contrary to popular opinion, economists don’t believe unregulated markets will naturally supply this type of systemic and collective behavioral change.  We also don’t put a lot of faith in the powers of moral suasion (even by the former Vice President).  Instead we believe in the power of incentives—the power of the price signal.  If carbon emissions are costly (through a carbon tax or from a cap-and-trade system), then goods produced using more carbon are more expense. By the law of demand, when prices rise, quantity demanded falls.  So if carbon-intensive goods are more expensive, fewer of those goods will be consumed and less carbon will be emitted.  Less carbon is emitted not because people care deeply about the impacts of climate change (although some may), but because they care deeply about their pocketbook.  Note that unregulated markets don’t result in the correct price signals; we do need public policy to address environmental problems.  We do need the big R—Regulation!

Let’s bring this discussion home to Duke.  If you go to sustainability.duke.edu you will see a carbon footprint calculator.  This tool asks you a series of questions about your eating habits, travel, and electricity consumption.  Questions include things like:  How far do you drive per trip to work?  How much of your food is locally produced?  Do you turn off your computer at night?  These are all very reasonable questions and clearly linked to each individual’s carbon consumption.  But perhaps we should also be asking: How many letters have you written your congressman demanding action on climate policy?  How many community meetings have you organized to explain climate policy to your neighbors and friends?  The “true believers” doing a lot won’t solve our problem.  We need carbon to be priced in order to affect behavior sufficiently to reduce overall carbon emissions.  How else can we “make the planet notice?”

I have lately been pondering the specific question of what Duke should do.  I have been asked to serve on the Campus Sustainability Committee and have agreed.  Universities are frequently leaders in sustainability efforts.  But even if Duke cut carbon emissions to zero, the planet would not notice.  Does this mean Duke should stop trying to lower its carbon footprint?  What is the role of the university in promoting environmental change?  Feel free to share your ideas for me to take to this committee.